We stopped contributing to CZM SRS account because she will stop working soon - "Semi-Retirement" For CZM.
Anyway, we have 3 portfolios on 2 accounts now due to our new strategy - New Strategy: StashAway + Supplementary Retirement Scheme (SRS):
KPO and CZM Cash - StashAway Risk Index 20%
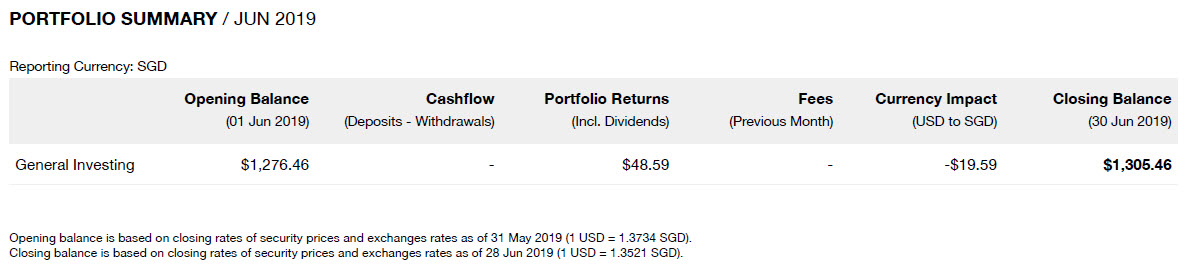
1. PORTFOLIO SUMMARY (as of the last day of the month)
Based on the statement (30 June 2019), KPO made $1,225.97 and CZM made $55.46.
As of 15 July 2019, these are our portfolio performance:
KPO: $21,794.97 (+18.7% - Capital: $20,000)
2. PORTFOLIO DETAILS
Note that these are reported in USD.
3. FEE CALCULATIONS

The fee stated is based on the monthly-average assets SGD $10,284.15 x 0.8% / 365 days * 30 days = $6.76. Without the referral, it would have been $13.34.

No fee for CZM for the first 6 months.
StashAway VS STI ETF
Since there is no way to compare the performances among the robo-advisors, I came out with a spreadsheet to track our StashAway portfolio performance (General Investing - Risk Level 28) against that of STI ETF which I will be updating on a monthly basis. For simplicity, I shall assume that one can either invest in Nikko STI ETF using POSB Invest-Saver or invest in Nikko STI ETF/SPDR STI ETF using SCB Priority Online Trading (no minimum commission). These would be the opportunity costs while we continue to invest in StashAway.
Apart from the absolute P&L, we should also look at the Reward-to-Risk Ratio where risk/volatility is taken into account. For more information, do read StashAway Clarifications - Reward-to-Risk Ratio. StashAway has the highest ratio of 1.25 which is significantly higher than the other 2 STI ETFs (< 0.4). Let me quote Freddy Lim (Co-Founder & Chief Investment Officer of StashAway), "for every dollar of risk taken, StashAway P28 is producing 1.25 times the return".

This is updated till 15th July 2019 and is based on only 1 of our portfolio - KPO and CZM Cash - StashAway Risk Index 20%.
This month commentary:
All green with StashAway portfolio providing a double-digit return. Going forward it will be even more interesting when the commissions/fees incurred by StashAway exceed that of POSB Invest-Saver. This will be a battle between cheaper/lesser fees and asset allocation/diversification...
I will be removing this spreadsheet going forward because Evan (founder of StocksCafe) has implemented a feature to add miscellaneous fee either to a particular stock (margin/leverage) or to a portfolio (robo).
StocksCafe

Looking at the time-weighted return (14.15%), we can see that StashAway is outperforming the STI ETF (including fees). In addition, it has lower volatility and max drawdown.

On the other hand, StashAway is underperforming the SPY (SPDR S&P 500 ETF Trust) with lower volatility and max drawdown.
Which is the best? Only time will tell :)
This is the link to our spreadsheet - KPO & CZM StashAway Portfolio VS STI ETF which I have also added to Our Portfolio page.
StashAway Referral Link for Our Readers
Here you go: KPO and CZM Referral Link
You might be interested in previous months update too:
StashAway - December 2018
StashAway - January 2019 - $16,051.10
StashAway - February 2019 - $17,397.81
StashAway - March 2019 - $18,780.96
StashAway - April 2019 - $19,702.85
StashAway - May 2019 - $20,823.09
StashAway - June 2019 - $22,031.43
Do like any of the following for the latest update/post!
1. FB Page - KPO and CZM
2. Twitter - KPO and CZM
3. Click here to subscribe using email :)
4. Instagram - KPO_and_CZM (Did you see those delicious food photos to the right --> Unfortunately, you can't see it on mobile.)
Anyway, we have 3 portfolios on 2 accounts now due to our new strategy - New Strategy: StashAway + Supplementary Retirement Scheme (SRS):
KPO and CZM Cash - StashAway Risk Index 20%
KPO SRS - StashAway Risk Index 13%
CZM SRS - StashAway Risk Index 13%
1. PORTFOLIO SUMMARY (as of the last day of the month)
 |
| KPO |
 |
| CZM |
 |
| KPO |
 |
| CZM |
KPO: $21,794.97 (+18.7% - Capital: $20,000)
CZM: $1,318.79 (+8.6% - Capital: $1,250)
2. PORTFOLIO DETAILS
Note that these are reported in USD.
 |
| KPO and CZM Cash - StashAway Risk Index 20% |
 |
| KPO SRS - StashAway Risk Index 13% |
 |
| CZM SRS - StashAway Risk Index 13% |
3. FEE CALCULATIONS

The fee stated is based on the monthly-average assets SGD $10,284.15 x 0.8% / 365 days * 30 days = $6.76. Without the referral, it would have been $13.34.

StashAway VS STI ETF
Since there is no way to compare the performances among the robo-advisors, I came out with a spreadsheet to track our StashAway portfolio performance (General Investing - Risk Level 28) against that of STI ETF which I will be updating on a monthly basis. For simplicity, I shall assume that one can either invest in Nikko STI ETF using POSB Invest-Saver or invest in Nikko STI ETF/SPDR STI ETF using SCB Priority Online Trading (no minimum commission). These would be the opportunity costs while we continue to invest in StashAway.
Apart from the absolute P&L, we should also look at the Reward-to-Risk Ratio where risk/volatility is taken into account. For more information, do read StashAway Clarifications - Reward-to-Risk Ratio. StashAway has the highest ratio of 1.25 which is significantly higher than the other 2 STI ETFs (< 0.4). Let me quote Freddy Lim (Co-Founder & Chief Investment Officer of StashAway), "for every dollar of risk taken, StashAway P28 is producing 1.25 times the return".
This is updated till 15th July 2019 and is based on only 1 of our portfolio - KPO and CZM Cash - StashAway Risk Index 20%.
This month commentary:
All green with StashAway portfolio providing a double-digit return. Going forward it will be even more interesting when the commissions/fees incurred by StashAway exceed that of POSB Invest-Saver. This will be a battle between cheaper/lesser fees and asset allocation/diversification...
I will be removing this spreadsheet going forward because Evan (founder of StocksCafe) has implemented a feature to add miscellaneous fee either to a particular stock (margin/leverage) or to a portfolio (robo).
StocksCafe

Looking at the time-weighted return (14.15%), we can see that StashAway is outperforming the STI ETF (including fees). In addition, it has lower volatility and max drawdown.

On the other hand, StashAway is underperforming the SPY (SPDR S&P 500 ETF Trust) with lower volatility and max drawdown.
Which is the best? Only time will tell :)
This is the link to our spreadsheet - KPO & CZM StashAway Portfolio VS STI ETF which I have also added to Our Portfolio page.
StashAway Referral Link for Our Readers
Here you go: KPO and CZM Referral Link
You might be interested in previous months update too:
StashAway - December 2018
StashAway - January 2019 - $16,051.10
StashAway - February 2019 - $17,397.81
StashAway - March 2019 - $18,780.96
StashAway - April 2019 - $19,702.85
StashAway - May 2019 - $20,823.09
StashAway - June 2019 - $22,031.43
Do like any of the following for the latest update/post!
1. FB Page - KPO and CZM
2. Twitter - KPO and CZM
3. Click here to subscribe using email :)
4. Instagram - KPO_and_CZM (Did you see those delicious food photos to the right --> Unfortunately, you can't see it on mobile.)
No comments:
Post a Comment