$$$ KPO and CZM $$$: September 2019

Tuesday, September 10, 2019

StashAway - SGD Income Portfolio

I received an email in the morning that there is a new portfolio. This is the content of the email and you can read more about it here - Introducing Our Income Portfolio:


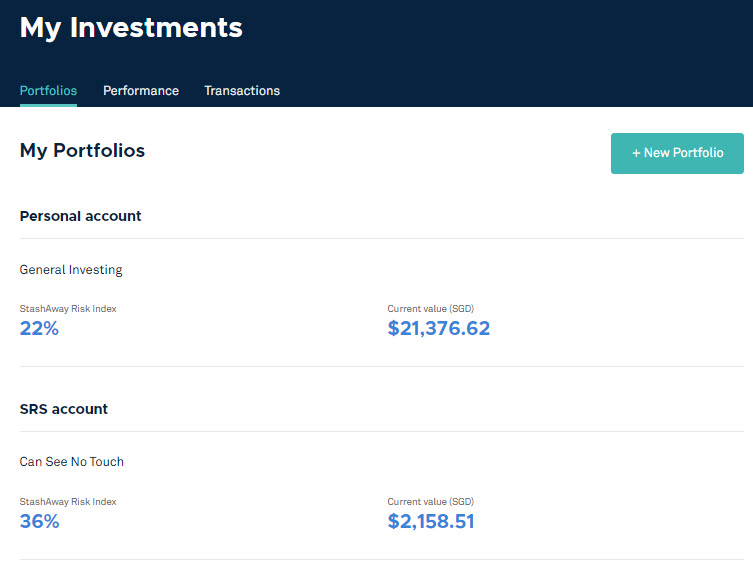
I immediately logged in to take a deeper look.


You need a minimum of SGD $10,000 for this portfolio as compared to its previously no minimum balance portfolio which is pretty high to start...


The portfolio is denominated in SGD (no foreign currency risk) and is at 12% StashAway Risk Index. This means there is a 1% chance of losing >= 12% in any year (even during a recession). The projected income/dividend yield is at 3.75% which I would consider it to be low. We will be able to see what are the underlying ETFs below.


It uses these 6 ETFs to pay out dividends and they will be distributed the month the ETFs pay them. Due to the low income/dividend yield, one will require a much higher capital.


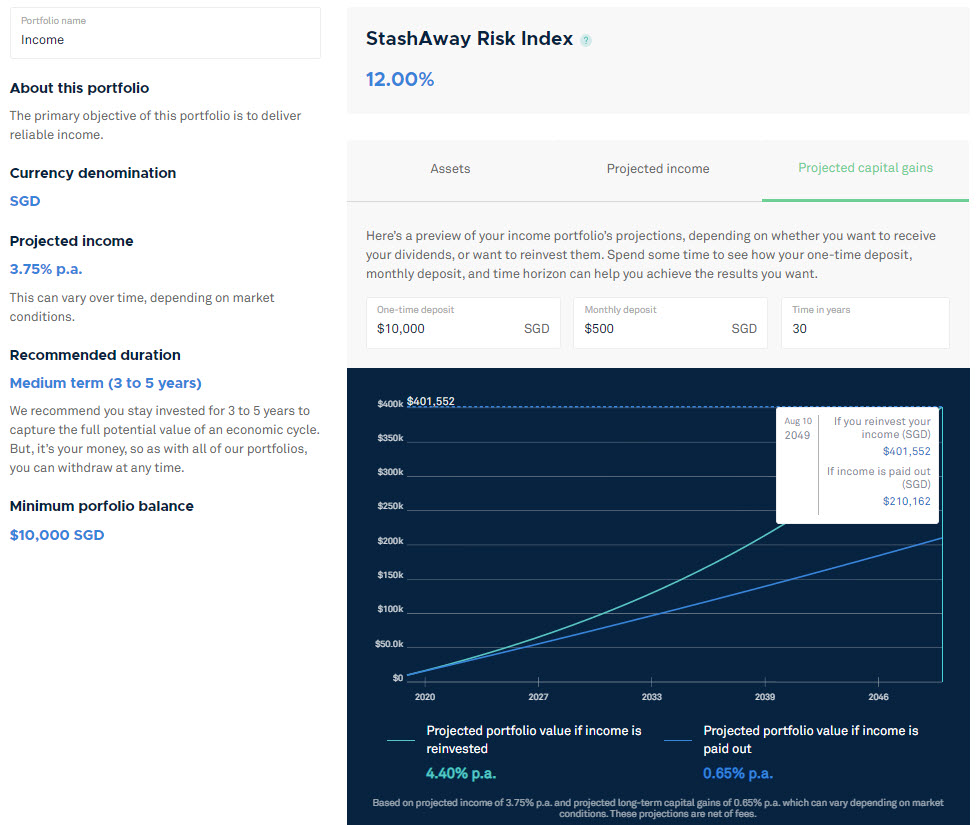
Similarly, one can also take a look at the projection of the portfolio. The difference between reinvesting the dividends is quite significant. 

Will I create one? To be honest, I am not a fan, so nope! My opinion is that the projected income/dividend for the portfolio is too low for me to achieve our goals and the reason for it being so low is due to the fees involved. The above income portfolio can be easily replicated since they are all listed on SGX for one-time trading fees of ~0.2+%.


If you still have a long investment horizon, the USD portfolio with similar risk index probably will provide a higher/better return. That few dollars of dividends you can get now isn't going to be life-changing but a $550k portfolio vs a $210k portfolio after 30 years will be.

The income portfolio is much more suitable for people who already have a huge amount of money and would prefer stability, ease of investment over growth. Another valid use case I can think of is for one to change their USD portfolio into the SGD income portfolio after it has grown/reached a significant size which is not available now (I tried).

Overall, I think StashAway is doing pretty well. All these changes show that they are still innovating and on the ball. They have also raised another USD $12 million in funding and should be around for some time. lol.

What are your thoughts?

Anyway, if you are interested in signing up for StashAway, do use our referral link - KPO and CZM Referral Link. You will get $10,000 free management fees for 6 months and we will get $16!

You might be interested in previous months update too:
StashAway - January 2019 - $16,051.10
StashAway - February 2019 - $17,397.81
StashAway - March 2019 - $18,780.96
StashAway - April 2019 - $19,702.85
StashAway - May 2019 - $20,823.09
StashAway - June 2019 - $22,031.43
StashAway - July 2019 - $‭23,486.36‬

Do like any of the following for the latest update/post!
1. FB Page - KPO and CZM
2. Twitter - KPO and CZM
3. Click here to subscribe using email :)
4. Instagram - KPO_and_CZM (Did you see those delicious food photos to the right --> Unfortunately, you can't see it on mobile.)

StashAway - Exciting Changes

This is slightly old news as the email (15th Aug 2019) and re-optimization (28th Aug 2019) has already happened but thought I will still blog about it.


We were pretty busy (Quick Update - Too Busy to Blog) during that period of time and I read through and proceeded with the re-optimization without taking any screenshots :( Anyway, I will not reinvent the wheel and you can read more in details on the new ETFs and re-optimization here:
- We've Added New Asset Classes and Geographies to Your Investments
- We're Re-Optimising Your Portfolios For New Economic Conditions

There is one thing I would like to point out is the highest risk profile for the balanced portfolio is now 22% if you did not realize. I also took the chance to change the risk profile for my SRS portfolio to 36% from 13% while CZM SRS portfolio became 14% from 13%. Although I did some analysis previously (New Strategy: StashAway + Supplementary Retirement Scheme (SRS)) and decided that 13% should be the most ideal, I decided to take on more risk for higher return because that is just a small amount that I can afford to lose (~0.25% of our net worth).

Let's look at the UI changes:
Portfolios - nothing much has changed


Performance - Addition of net deposits (Good, a lot clearer now). Removal of the breakdown of returns by investment and currency impact (Bad - lost visibility to the currency impact on returns) and the total return in percentage (Bad, need to click into the individual portfolio to see the returns in percentage).


Individual Portfolio, Overview - It shows 2 different returns now (Good, computation of return is complicated and can be biased, hence the more the better. lol).

Money-weighted return
What is Money-weighted Return?
Money-weighted Return (MWR) helps to gauge the effectiveness of an investor’s timing of deposits and withdrawals. It does this by including the effects of multiple cash flows by assigning a weight to each of your deposits and withdrawals. In other words, a deposit or withdrawal of $1,000 SGD has a lesser effect on your portfolio’s return figure than a deposit or withdrawal of $100,000 SGD. Before this change, we were displaying returns using the Modified Dietz Method, which is a version of MWR.


Time-weighted return
What is Time-weighted Return?
Time-weighted Return (TWR) is commonly-used in the financial industry, making it an easy metric to compare returns between different portfolio managers. TWR measures the portfolio manager’s ability to generate returns, not the effects of an investor’s deposit and withdrawal behaviours. It does this by tracking performance from the first deposit made into a portfolio.

Individual Portfolio, Assets - Better visualization of how your investments are diversified across different asset classes and geography. 


I like it except for the part where the units are not displayed on the same screen and I have to click on individual ETF to see the units I have. Having said that, there are more information about each of the ETF and clicking on more information on the ETF will redirect you to etf.com which is pretty neat. In the past, this information on all the ETFs was at a single place including those that are not in your portfolio.


Individual Portfolio, Projections - This is my personal favorite! The projection is now showing a 75% probability instead of a 50% probability. I remember blogging about this 2 years ago on how 50% probability is a joke - Introduction to StashAway - Robo-Advisor/Automated Investing.


In order to increase the probability, the projected portfolio value will definitely drop. So do take a look and readjust your financial/retirement plan accordingly.

All in all, mostly good changes with clearer display of information and better visualization!

StashAway Referral Link for Our Readers
Here you go: KPO and CZM Referral Link

You might be interested in previous months update too:
StashAway - January 2019 - $16,051.10
StashAway - February 2019 - $17,397.81
StashAway - March 2019 - $18,780.96
StashAway - April 2019 - $19,702.85
StashAway - May 2019 - $20,823.09
StashAway - June 2019 - $22,031.43
StashAway - July 2019 - $‭23,486.36‬

Do like any of the following for the latest update/post!
1. FB Page - KPO and CZM
2. Twitter - KPO and CZM
3. Click here to subscribe using email :)
4. Instagram - KPO_and_CZM (Did you see those delicious food photos to the right --> Unfortunately, you can't see it on mobile.)

Monday, September 9, 2019

StashAway - July 2019

StashAway introduced some major changes around mid-August. The changes had did not affect July's portfolio but I will briefly mention it here:
- New and more ETFs
- Re-optimisation of portfolio once changes are reviewed or automatically on 28th August
- Computation of portfolio returns (total return, time-weighted return, and money-weighted return) 
- UI changes

More information can be found here - We've Added New Asset Classes and Geographies to Your Investments

We stopped contributing to CZM SRS account because she will stop working soon - "Semi-Retirement" For CZM.

Anyway, we have 3 portfolios on 2 accounts now due to our new strategy - New Strategy: StashAway + Supplementary Retirement Scheme (SRS):
KPO and CZM Cash - StashAway Risk Index 20%
KPO SRS - StashAway Risk Index 13%
CZM SRS - StashAway Risk Index 13%

1. PORTFOLIO SUMMARY (as of the last day of the month)

KPO
CZM

Based on the statement (31 Jul 2019), KPO made $1,906.91 and CZM made $79.45.

KPO
CZM

As of 06 Sep 2019, these are our portfolio performance:
KPO: $23,535.13 (+$2,535.13 - Capital: $21,000)
CZM: $1,620.06 (+$120.06 - Capital: $1,500)

2. PORTFOLIO DETAILS 
Note that these are reported in USD.

KPO and CZM Cash - StashAway Risk Index 20%

KPO SRS - StashAway Risk Index 13%

CZM SRS - StashAway Risk Index 13%

3. FEE CALCULATIONS


One of my referral was not captured last month, contacted their support and was given a goodwill credit of $10. The fee stated is based on the monthly-average assets and it would have been SGD $21,617.59 x 0.8% / 365 days * 31 days = $14.69.


The fee stated is based on the monthly-average assets SGD $1,322.21 x 0.8% / 365 days * 31 days = $0.90. 

StocksCafe


Looking at the time-weighted return (17.39%), we can see that StashAway is outperforming the STI ETF (including fees). In addition, it has lower volatility and max drawdown.


On the other hand, StashAway is underperforming the SPY (SPDR S&P 500 ETF Trust) with lower volatility and max drawdown.

Which is the best? Only time will tell :)

This is the link to our spreadsheet - KPO & CZM StashAway Portfolio VS STI ETF which I have also added to Our Portfolio page.

StashAway Referral Link for Our Readers
Here you go: KPO and CZM Referral Link

You might be interested in previous months update too:
StashAway - January 2019 - $16,051.10
StashAway - February 2019 - $17,397.81
StashAway - March 2019 - $18,780.96
StashAway - April 2019 - $19,702.85
StashAway - May 2019 - $20,823.09
StashAway - June 2019 - $22,031.43
StashAway - July 2019 - $‭23,486.36‬

Do like any of the following for the latest update/post!
1. FB Page - KPO and CZM
2. Twitter - KPO and CZM
3. Click here to subscribe using email :)
4. Instagram - KPO_and_CZM (Did you see those delicious food photos to the right --> Unfortunately, you can't see it on mobile.)

Wednesday, September 4, 2019

Soilbuild Business Space REIT (Not) Bad Preferential Offering

I received an SMS earlier today from SCB - corporate action.


The first thing that came to mind was will this be dilutive or accretive? You should be able to guess it from the title of my post. To be honest, I have not been keeping up with the market news so this is new to me. Went to dig through the announcement and wanted to do a quick summary.

Soilbuild REIT will be acquiring a new Grade A office building in Australia - 25 Grenfell Street, Adelaide for A$134.22 million (S$127.51 million) but will be paying approximately A$142.01 million (S$134.91 million) due to various fees, out of which S$101.8 million will be raised through this preferential offering.
Every 18 New Units will be issued for every 100 existing units in Soilbuild REIT (the “Units”) held as at 5.00 p.m. on Thursday, 29 August 2019 to Eligible Unitholders (as defined herein) (fractions of a New Unit to be disregarded) at an issue price of S$0.530 per New Unit.

Let's take a look at the illustrated Pro Forma DPU and NAV. Focus on Scenario B and also note that these are illustrated numbers assuming acquisition happened in 2018.


Decreased in DPU.


Decreased in NAV. Only OUE REIT can do better worst? If we were to look passed the DPU and NAV dilution, this may actually be a decent/good move for Soilbuild REIT...


Let's face it, Soilbuild REIT's DPU has been declining over the years after facing a few defaults (NK Ingredients and Technics Oil and Gas), decreased occupancy and negative rental reversions. As a result, this preferential offering has minimum damage but actually improves its portfolio (out of Singapore + Grade A office building vs its existing industrial buildings).

In my 5 minutes researching time, I believe Soilbuild did not overpay for the building. Credit Suisse put it up for sale earlier this year and it was speculated to be worth as much as A$150 million - Credit Suisse to check out of Adelaide tower.


Their latest 1H financial results are already showing clear signs of declining DPU by another ~10%. Assuming we extrapolate the DPU for FY 2019, it will be 4.628. At an issue price of $0.53, that translates to 8.7% dividend yield for an existing shareholder. If you choose not to subscribe, you will just be diluted and since this is a non-renounceable offering, you cannot even sell the rights. In another word, you are stuck. Just exercise it :)

On the bright side, depending on your entry/average price, this may not be a bad offer for you. In my case, my average price was very high ($0.701) and it became accretive if the calculations are based on cost/average price. Needless to say, I will exercise all of them and apply in excess!


You can use my google spreadsheet/calculator to see how would this rights issue work out for you - KPO Rights Issue Calculator

Fun fact: Soilbuild REIT is buying the building from Credit Suisse who bought the at A$125 million in 2016. They made A$9 million in just 3 years!

References:
PROPOSED ACQUISITION OF 25 GRENFELL STREET, ADELAIDE, AUSTRALIA
LAUNCH OF FULLY UNDERWRITTEN PREFERENTIAL OFFERING TO RAISE GROSS PROCEEDS OF APPROXIMATELY S$101.8 MILLION
25 Grenfell St, Adelaide CBD, sells for $125 million to Credit Suisse

Do like any of the following for the latest update/post!
1. FB Page - KPO and CZM
2. Twitter - KPO and CZM
3. Click here to subscribe using email :)
4. Instagram - KPO_and_CZM (Did you see those delicious food photos to the right --> Unfortunately, you can't see it on mobile.)